
Wind Product Demonstration in Real Time
NB! The producs for Metop-SG-A1 data are still in pre-operational status.

Interpreting the HRW images
Please note that the actual wind products are found in the
HRW
netCDF/BUFR-datafiles.
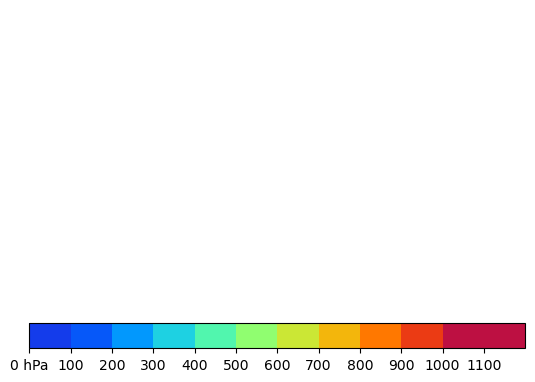
But as an appetizer, here is shown a plot of
the atmospheric motion vectors with different colours at
different heights (in hPa), or
coloured according to the wind speed. Both types of images also
show the windspeed using barbs:
- half a barb is 5 knots
- one barb is 10 knots
- a triangle is 50 knots
Information about wind products in the PPS reference system
The wind products are generated operationally in real time at
SMHI,
on data from the direct readout station in Norrköping. This this is a part of
Nowcasting Satellite Application Facilities Polar Platform System
(NWC SAF/PPS) reference system.
The high resolution wind product (HRW)
shown here is still an demonstrational product, and is a part of
NWC SAF/PPS
version 2021.
Satellite data
The satellite data used is mainly direct readout data from the X/L-band station in Norrköping. In addition to the local data also data from the EARS-AVHRR service received via EUMETCast are being used as well as, occasionally, direct readout data from neighbouring stations in Finland and Norway.
The HRW product requires two different satellite passages of the same area in order to create a product. Thus, if the passages are sparse, there might be a some HRW products missing because they could not pair up.
Data reception schedule
Here you can find the Direct Readout schedule of polar satellites being received in real time at the X/L-band station in Norrköping.
NWP-data
The numerical model used in the reference system is ECMWF retrieved with a spatial resolution of 0.25° and a temporal step of 3 hours, with base times of 00Z and 12Z. NWP fields at the surface level, at 10 metre, and at 54 hybrid levels are used for HRW.
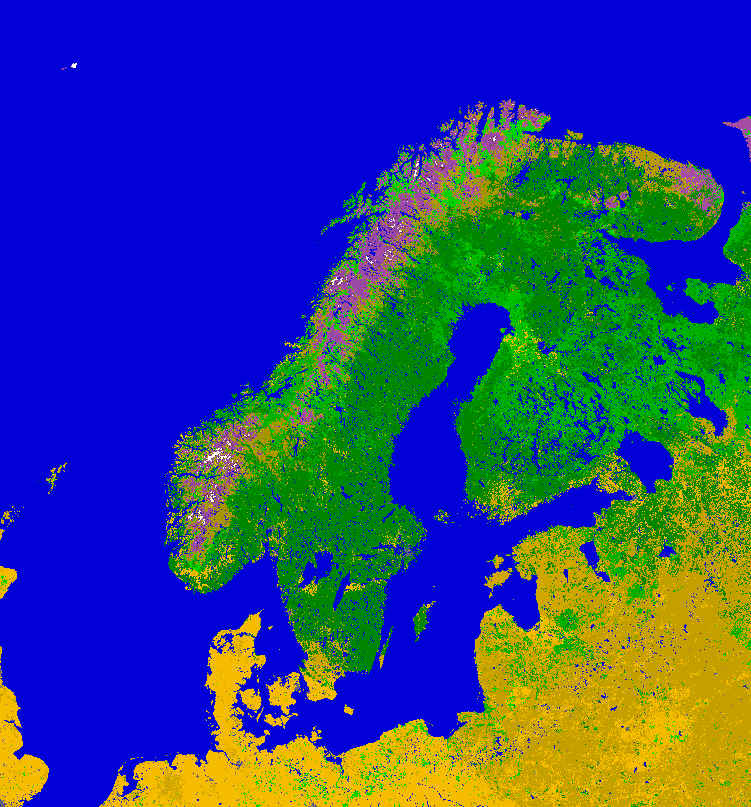
Description of the default areas
The wind products in the reference system are produced in two map-projected regions, mainly covering the area of interest of Sweden and the nordic countries. Please note that the wind products are using other areas than the cloud products.
The
locations of the areas are illustrated below, displaying the 1km
USGS
landuse data used.
Arome - 3km is a nordic area used by MetCoOp with a
resolution of 3 km per pixel. It is in Lambert conformal conic
projection.
Scandinavia - 1km is a northern European area, with a
resolution of 1km per pixel. It is in Polar stereographic projection.